The Canadian housing market has been cooling for months, as it adjusts to the new stress test, rising interest rates, and foreign buyer taxes in Toronto and Vancouver.
It’s a slump that might be more than the government hoped for, according to RBC Global Asset Management chief economist Eric Lascelles.
“While [sales are] disproportionately [down in] Toronto (down nearly 50 per cent since its peak), it is also Newfoundland (down 31 per cent), British Columbia (down 30 per cent), Alberta (down 23 per cent), Saskatchewan (down 18 per cent) and a host of other provinces,” he writes. “Quebec gets off quite lightly, but it is also down (if by only 3 per cent).”
For a closer look at how regulation has taken out a bite out of the market, BuzzBuzzNews has rounded up 7 charts that put things in perspective.
1. Homeownership is down in almost every major market
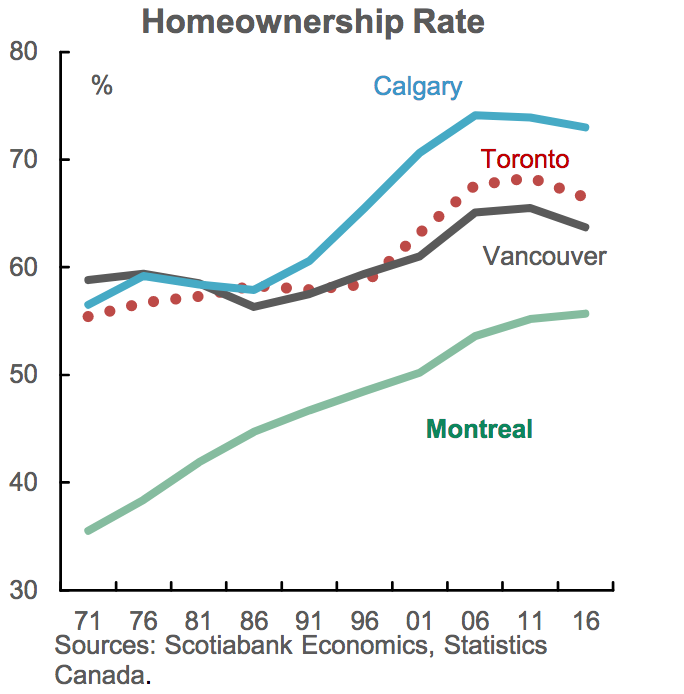
What’s going on here: Scotiabank Economics compared homeownership rates over the last four decades in Toronto, Vancouver, Calgary and Montreal.
The takeaway: With the exception of Montreal, each city has seen a major dip in homeownership over the past few months, after peaking this time last year.
2. Toronto sales are down significantly

What’s going on here: The Toronto Real Estate Board graphed monthly home sales over the past four years.
The takeaway: While sales inched upwards month-over-month in April, they’re still down significantly from where they were in 2015, 2016 and 2017.
3. Actual and average sales are both down in Toronto

What’s going on here: The Toronto Real Estate Board tracked the number of actual MLS sales against the 12-month moving average since 1995.
The takeaway: While actual sales are down, the 12-month moving average took a particularly steep dive in 2018, indicating that sales are trending downwards.
4. National home sales continue to fall

What’s going on here: The Canadian Real Estate Association (CREA) tracked home sales over the past year.
The takeaway: After a dramatic drop off in January, sales have continued to fall, including a 2.9 per cent drop in April. As CREA reports, 60 per cent of local housing markets reported fewer sales last month.
5. National home prices have also fallen

What’s going on here: The Canadian Real Estate Association tracked national home prices over the past year.
The takeaway: Prices where down 11.34 per cent year-over-year in April, with the national average price of a home sitting at just over $495,000, down significantly from the $540,000 average home price in April 2017.
6. Average prices have fallen across Ontario

What’s going on here: Realosophy tracked the percent change in average price across different Ontario municipalities from Q1 2017 to Q1 2018.
The takeaway: Prices fell sharply across Ontario in the first quarter of 2018, with Richmond Hill seeing a steep 30 per cent drop in prices, while almost every market saw prices fall by at least 5 per cent.
7. The market is still in balanced territory

What’s going on here: Scotiabank Economics tracked the national sales-to-new-listings ratio over the past 18 years. A ratio of between 40 to 60 per cent is considered balanced, with readings above or below indicating sellers or buyers markets, respectively.
The takeaway: After dropping steeply from sellers territory in April of 2017, the market has yet to fully recover and make its way back up.
